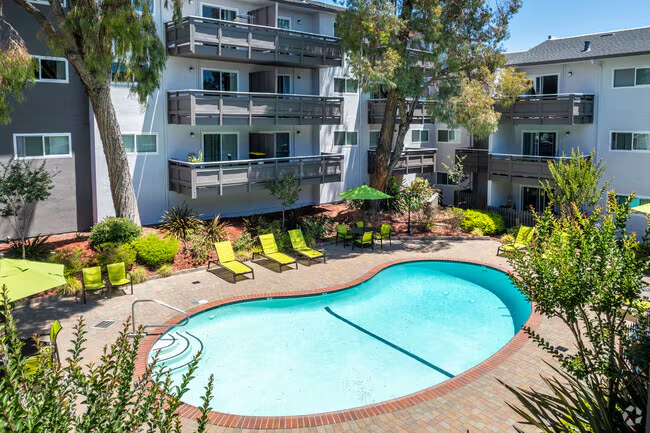
Ashland
California
Powered by
C+Renter Score
Population
22,210
Median Income
$82K
% Renters
65%
Median Rent
$2,110/mo
Available Rentals
50
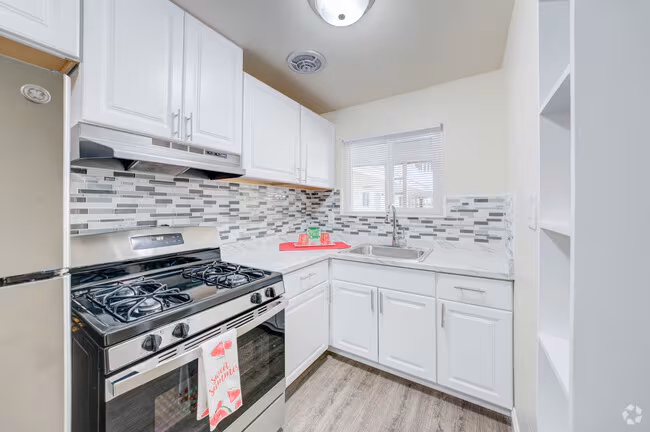
Studio
$1,595/mo
1 available
1 Bedroom
$2,005/mo
73 available
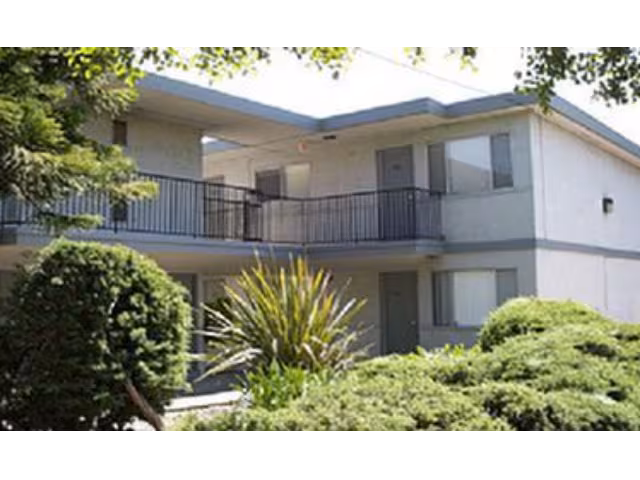
2 Bedroom
$2,525/mo
48 available
3+ Bedroom
$3,525/mo
10 available
1Studios avail.
731BR avail.
482BR avail.
103BR+ avail.
Rent Affordability
How does Ashland compare?
Median rent relative to Oakland and the broader Bay Area market.
vs Oakland Average9% lower
vs Bay Area Average20% lower
vs National Average+51% higher
Census Rent Data
Rent Distribution
How much residents in Ashland pay in rent (Census data).
Under $500
5%
$500–$999
2%
$1,000–$1,499
6%
$1,500–$1,999
29%
$2,000+
57%
Neighborhood Grades
Powered byPublic SchoolsC+
Cost of LivingD+
Safety—
NightlifeA
Outdoor ActivitiesA
WalkabilityA-
Compare Nearby Cities
NeighborhoodMedian RentAvailableOverall
Ashland$2,110—C+
Weather
Average Temperatures
Monthly high and low temperatures in Ashland.
80°60°40°
58°44°
62°47°
64°49°
66°50°
69°53°
72°55°
72°56°
73°58°
74°57°
72°54°
65°49°
58°45°
Jan
Feb
Mar
Apr
May
Jun
Jul
Aug
Sep
Oct
Nov
Dec
Demographics & Diversity
Population, age distribution, and diversity breakdown for Ashland.
Population22,210
Median Age50
Median Income$82K
Diversity Index: 0.62
Hispanic
44%
Asian
21%
Black
19%
White
11%
Two or More
4%
Pacific Islander
1%
Housing Stock
Types of Housing
Housing type and age distribution in Ashland.
Home Types
Single Family
42%
Large Apt Building
35%
Small Apt Building
16%
Townhouse
5%
Mobile Home
1%
Home Age
2000–Present
8%
1980–1999
18%
1960–1979
28%
1940–1959
38%
Before 1939
8%
Commute & Transportation
Avg Commute36 min
Drive Alone70%
Walk/Bike2%
Work from Home7%